IEEE International Conference on Multimedia
& Expo 2001
Tokyo, Japan
Electronic Proceedings © 2001 IEEE
Abstract
We introduce the beat spectrum, a new method of
automatically characterizing the rhythm and tempo of music and audio.
The beat spectrum is a measure of acoustic self-similarity as a
function of time lag. Highly structured or repetitive music will have
strong beat spectrum peaks at the repetition times. This reveals both
tempo and the relative strength of particular beats, and therefore can
distinguish between different kinds of rhythms at the same tempo. We
also introduce the beat spectrogram which graphically illustrates
rhythm variation over time. Unlike previous approaches to tempo
analysis, the beat spectrum does not depend on particular attributes
such as energy or frequency, and thus will work for any music or audio
in any genre. We present tempo estimation results which are accurate to
within 1% for a variety of musical genres. This approach has a variety
of applications, including music retrieval by similarity and
automatically generating music videos.
Table
of Contents
1. Introduction
2. Previous Work
3. The Algorithm
4. The Beat
Spectrogram
5. Onset Detection
6. Evaluation
7. Applications
8. References
1.
Introduction
Anyone who has ever tapped a foot in time to music has performed rhythm
analysis. Though simple for humans, this task is considerably more
difficult to automate. We introduce a new measure of tempo analysis
called the beat spectrum. This is a measure of acoustic self-similarity
versus lag time, computed from a representation of spectrally
similarity. Peaks in the beat spectrum correspond to major rhythmic
components of the source audio. The repetition time of each component
can be determined by the lag time of the corresponding peak, while the
relative amplitudes of different peaks reflects the strengths of their
corresponding rhythmic components. We also present the beat spectrogram
which graphically illustrates rhythmic variation over time. The beat
spectrogram is an image formed from the beat spectrum over successive
windows. Strong rhythmic components are visible as bright bars in the
beat spectrogram, making changes in tempo or time signature visible. In
addition, a measure of audio novelty can be computed that measures how
novel the source audio is at any time [2]. Instances when this measure is
large correspond to significant audio changes. Periodic peaks
correspond to rhythmic periodicity in the music. In the final section,
we present various applications of the beat spectrum, including music
retrieval by rhythmic similarity, an "automatic DJ" that can smoothly
sequence music with similar tempos and automatic music video
generation.
(Table of Contents)
2.
Previous Work
It is straightforward to segment audio that has significant
intersegment silence. This simple approach is used in many commercial
audio processing software. Much interesting audio does not contain
significant silence, however, including most popular music. Several
groups have reported work on musical beat-tracking and analysis. A
successful approach uses correlated energy peaks across frequency
sub-bands [3].
Another approach depends on assumptions such as the music must be in
4/4 time and have a bass drum on the downbeat [4].
A novel approach is to compute rhythmic similarity for a search
application [1].
Here, a "bass loudness time-series" is generated by weighting the
short-time Fourier transform (STFT) to favor low frequencies. A peak in
the Fourier analysis of this time series is chosen as the "fundamental"
period. The Fourier result is normalized and quantized into durations
of 1/6 of a beat, so that both duplet and triplet subdivisions can be
represented. This serves as a feature vector for rhythmic similarity
comparison. This approach works well for drum patterns, but is likely
to be confused by music with significant bass energy not due to drums.
In contrast, the approach presented here has the advantage that it does
not rely on particular features such as silence, periodic energy peaks,
or specific time signatures. Because it is based on self-similarity,
the only required features are repetitive events (even silence) in the
source audio.
(Table of Contents)
3.
The algorithm
The beat spectrum is calculated from the audio using three principal
steps. First, the audio is parametrized using a spectral or other
representation. This results in a sequence of feature vectors. Second,
a distance measure is used to calculate the similarity between all
pairwise combinations of feature vectors, hence times in the audio.
This is embedded into a two-dimensional representation called a
similarity matrix. The beat spectrum results from finding periodicities
in the similarity matrix, using diagonal sums or autocorrelation. The
following sections present each step in more detail.
3.1 Audio parameterization
The methods presented here are all based on the distance matrix, which
is a two-dimensional embedding of the audio self-similarity [6].
The first step is to parameterize the audio. This is typically done by
windowing the audio waveform. Various window widths and overlaps can be
used; in the present system windows ("frames") are 256 samples wide,
and are overlapped by 128 points. For audio sampled at 22kHz, this
results in a 11 ms frame width. A fast Fourier transform is performed
on each frame, and the logarithm of the magnitude of the result
estimates the power spectrum. The result is a compact vector of
parameters that characterizes the spectral content of the frame. Many
compression techniques such as MPEG-1 Layer 3 use a similar spectral
representation, which could be used for a distance measure. Other
parameterizations could be used, including those based on linear
prediction, Mel-Frequency Cepstral Coefficient (MFCC) analysis [7],
or psychoacoustic considerations.
3.2 Calculating frame similarity
Once the audio has been parameterized, it is then embedded in a
2-dimensional representation. A (dis)similarity measure
D between feature vectors  and
and  is calculated from audio frames
i and
j
. A simple distance measure is the Euclidean distance in the parameter
space. To remove the dependence on magnitude (and hence energy, given
our features), the product can be normalized to give the cosine of the
angle between the parameter vectors.
The cosine measure ensures that windows with low energy, such as those
containing silence, can still yield a large similarity score, which is
generally desirable. This is the distance measure used here.

3.3 Distance Matrix Embedding
It is convenient to consider the similarity between all possible
instants in a signal. This is done by embedding the distance measure in
a two-dimensional representation. The similarity matrix
S
contains the distance metric calculated for all frame combinations
(hence time indexes
i and
j)
such that the
i, j
th element of
S is
D(i, j)
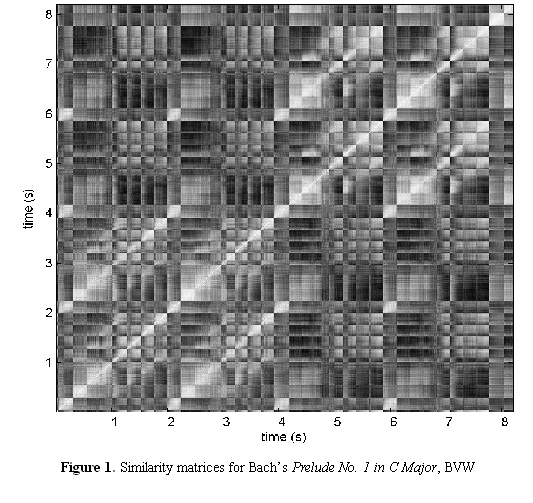
. S can be visualized as a square image where each pixel
i, j is given a gray scale value proportional to the
similarity measure
D(i,j)
, and scaled such that the maximum value is given the maximum
brightness. These visualizations let us clearly see the structure of an
audio file. Regions of high audio similarity, such as silence or long
sustained notes, appear as bright squares on the diagonal. Repeated
figures will be visible as bright off-diagonal rectangles. If the music
has a high degree of repetition, this will be visible as diagonal
stripes or checkerboards, offset from the main diagonal by the
repetition time.
Figure 1 shows the first seconds of
Bach's Prelude No. 1 in C
Major, from The Well-Tempered Clavier, BVW 846. (In these
visualizations, image rather than matrix coordinate conventions are
used, thus the origin is at the lower left and time increases both with
height and to the right.) The figure depicts a 1963 piano performance
by Glenn Gould. Thirty-four notes can be seen as squares along the
diagonal. The repetition time is visible in the off-diagonal stripes
parallel to the main diagonal, as well as the repeated C note at 0, 2,
4, and 6 seconds. Despite Gould's typically idiosyncratic performance,
the music has a strong periodicity, indicated by the spectral peak at
about 2 seconds, which corresponds to the length of an 8-note phrase.
3.4 Deriving the beat spectrum
Both the periodicity and relative strength of rhythmic structure can be
derived from the similarity matrix. We call a measure of
self-similarity as a function of the lag the beat spectrum B(l). Peaks
in the beat spectrum correspond to repetitions in the audio. A simple
estimate of the beat spectrum can be found by summing
S along the diagonal as follows:
Here,
B(0) is simply the sum along the main diagonal over some
continuous range
R
,
B(1) is the sum along the first superdiagonal, and so forth.
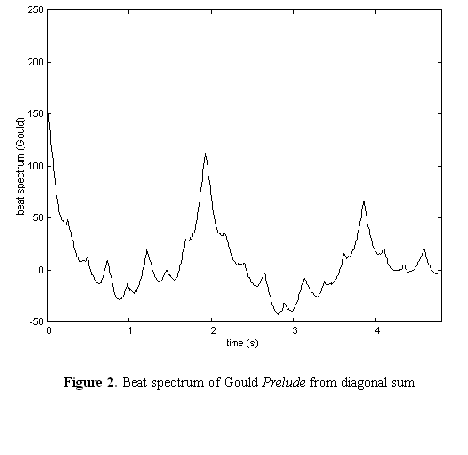
Figure
2 shows an example computed for a range of 3 seconds in the Gould
performance. The periodicity of each note can be clearly seen, as well
as the strong 8-note periodicity of the phrase at about 2 seconds.
Notice the peaks at notes 3 and 5, due to the three-note periodicity of
the eight-note phrase. In each phrase, notes 3 and 6, notes 4 and 7,
and notes 5 and 8 are the same.
A more robust estimate of the beat spectrum comes from the
autocorrelation of
S
:

Because
B(k,l) is symmetric, it is only necessary to sum over one
variable, giving the one-dimensional result
B(l). This approach works surprisingly well across a range
of musical genres, tempos, and rhythmic structures.
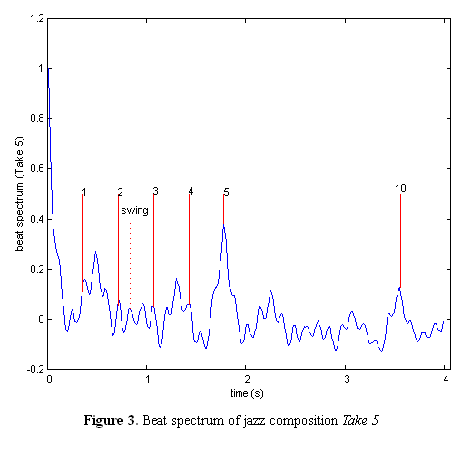
Figure 3 shows the beat spectrum computed from the first 10 seconds of
the jazz composition
Take 5 by the Dave Brubeck
Quartet. Besides being in the unusual 5/4 time signature, this
rhythmically sophisticated piece requires some interpretation. The most
visible feature is the beat spectral peak at 5 beats, and a
corresponding sub-harmonic at 10. Note that quarter-note beats
(annotated with solid vertical lines in the figure) are not the major
peaks. Jazz aficionados know that "swing" is the subdivision of beats
into non-equal periods rather than "straight" (equal) eighth-notes. The
beat spectrum clearly shows that each beat is subdivided into a
triplet. This is indicated with dotted lines spaced 1/3 of a beat apart
between the second and third beats.
(Table
of Contents)
4.
The beat spectrogram
Just as the power spectrum discards phase information, the beat
spectrum discards absolute timing information. We introduce the beat
spectrogram for analyzing rhythmic variation over time. The spectrogram
visualized the spectral evolution across successive windows. Likewise,
the beat spectrogram visualizes the beat spectrum over successive
windows to show rhythmic variation over time. The beat spectrogram is
an image formed by successive beat spectra. Time is on the x axis, with
lag time on the y axis. Each pixel in the beat spectrograph is colored
with the scaled value of the beat spectrum at that time and lag, so
that beat spectrum peaks are visible as bright bars in the beat
spectrogram. The beat spectrograph shows how tempo varies over time.
For example, an accelerating rhythm will be visible as bright bars that
slope downward, as the lag time between beats decreases with time.

The beat spectrum has interesting parallels with the frequency
spectrum. Firstly, there is an inverse relation between the time
accuracy and the beat spectral precision. This is because you need more
periods of a repetitive signal to more precisely estimate its
frequency. The longer the summation range, the better the beat
accuracy, but of course the worse the temporal accuracy. (Technically,
the beat spectrum is a frequency operator, and therefore does not
commute with a time operator.) In particular, if the tempo changes over
the analysis window, it will "smear" the beat spectrum. Analogously,
changing a signal's frequency over the analysis window will result in a
smeared frequency spectrum. Thus beat spectral analysis, just like
frequency analysis, is a trade-off between spectral and temporal
resolution.
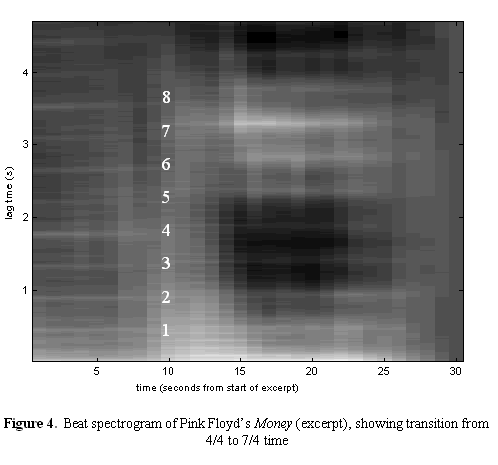
Figure 4
shows the beat spectrogram of a
33-second excerpt of the Pink Floyd song
Money. Listeners familiar with this classic-rock chestnut may
know the song is primarily in the 7/4 time signature (each measure
consists of seven quarter-note beats), save for the bridge (middle
section), which is a more common blues progression in 4/4. The excerpt
shown starts approximately four minutes and 55 seconds into the song,
just before the transition from the 4/4 bridge back into the last 7/4
verse. This transition is clearly visible. On the left, there are
strong beat spectral peaks (indicated by white numbers) on each beat,
and particularly at two beats (the "backbeats" 2 and 4), four beats
(the length of a 4/4 bar), and an eight-beat subharmonic. Two beats
occur in slightly less than a second, corresponding to a tempo slightly
faster than 120 beats per minute (120 MM). This is followed by a short
two-bar transition, still in 4/4. Then the time signature changes to
7/4, which is clearly visible as a strong seven-beat peak with the
absence of a four-beat component. Note also there is a slight
deccelerando (tempo slowing) into the transition, as can be seen by the
4-beat peak curving upward slightly. The last verse is slightly slower
than the bridge, so the large seven-beat peak is slightly higher (takes
longer time) than the corresponding seven-beat peak in the
bridge.
(Table of Contents)
5.
Onset detection
Since many applications of beat tracking require an estimate of not
only how often but when a beat occurs, we use an onset detector to
precisely locate rhythmic events in time. Onset times can be derived
from the similarity matrix
S using a classic matched-filter techniques: correlating
S with a kernel that itself looks like a checkerboard, as in
[2].
Peaks in the beat spectrum give the fundamental rhythmic periodicity,
while peaks in the correlation give the precise downbeat time or phase.
Correlating the novelty score with a comb-like function with a period
from the beat spectrum yields a signal that has strong peaks at every
beat.
(Table of Contents)
Table 1: Results of
tempo
analysis estimation
|
Track
|
Genre
|
BSP
(s)
|
time
(s) / beats
|
ratio
|
|
seg0005.mp3
|
theme intro
|
0.551
|
2.185 / 4
|
1.009
|
|
seg0028.mp3
|
theme + vox
|
1.097
|
4.333 / 8
|
2.025
|
|
seg0139.mp3
|
dance/hip-hop
|
1.056
|
2.099 / 4
|
2.012
|
|
seg0531.mp3
|
pop/rock
chorus
|
0.313
|
4.963 / 8
|
0.505
|
|
seg0602.mp3
|
pop/rock
verse
|
0.621
|
4.926 / 8
|
1.009
|
|
seg1110.mp3
|
vox/guitar
|
1.01*
|
4.070 / 8
|
1.985
|
|
seg1405.mp3
|
R&B
vox
|
0.319
|
5.065 / 8
|
0.504
|
|
seg1455.mp3
|
dance/vox
|
1.027
|
4.091 / 8
|
2.008
|
6.
EVALUATION
Benchmarking is not straightforward, as a "beat" is somewhat arbitrary
and genre-dependent. Different listeners might characterize the same
rhythm as having either eight eighth-note beats or four quarter notes,
and thus misjudge the tempo by a factor of two. To test the accuracy of
the beat spectral method, musical segments of different popular genres
were extracted from the video "Musica Si" from the MPEG-7 content set [9].
Segments lasted 10 seconds, and are labeled segMMSS, where MMSS are the
minutes and seconds of the segment start time in the video. The tempo
was estimated by the simple heuristic of picking the highest peak in
the beat spectrum having a lag of greater than 1/6 second. For a ground
truth tempo, durations of 4- or 8-beat phrases was manually measured.
Table 1 shows the results. For each segment, the third column shows the
beat spectral peak (BSP): the lag of the highest peak greater than 1/6
s. (The exception was seg1100 where the simplistic peak-picking failed;
however the peak was obvious by inspection.) The fourth column shows
the measured time for a 4- or 8-beat phrase. The last column shows the
ratio between the estimated and measured beat: the closer this is to an
integral ratio, the more accurate the BSP tempo estimate. Like many
listeners, the BSP may misjudge the dominant tempo as an integral
factor of the fundamental period. Accounting for this, the BSP tempo
estimates are correct to within 1% of the measured value, even though
they are only accurate to within one analysis window, roughly 1/100 s.
Note that the largest source of measurement error here is the manual
segmentation and probably not the
BSP. (Table
of Contents)
7.
Applications
The ability to reliably segment and beat-track audio has a large number
of useful applications. Note that this approach can be used for any
time-dependent media, such as video, where some measure of
point-to-point similarity can be determined.
Determining rhythmic similarity
Rhythmically similar music will have similar beat spectra. A measure of
similarity could be computed by comparing the beat spectra. Among other
applications, this allows retrieval by rhythmic similarity: a
collection of music could be ranked by similarity to a given musical
example. The beat spectra could be normalized by tempo period so that
rhythmic similarity can be compared independently of tempo, as in [1].
Another application might be to arrange songs by similar tempo and
rhythm so that the transition between them is smooth.
Music segmentation by rhythm
Songs can be segmented by clustering the beat spectrogram. For example,
the Pink Floyd song of
Figure 4 could be segmented into 4/4 and 7/4 regions, corresponding to
the bridge and verses of the song structure.
Automatic tempo extraction
Knowing the song structure, tempo, and beat times allows
synchronization of external events to the audio. For example, an
animated character could nod or dance to the musical tempo. Video clips
could be automatically sequenced to match the tempo of an chosen
musical soundtrack.
(Table of Contents)
8.
References
-
Wold,
E., Blum, T., Keislar, D., and Wheaton, J., "Classification, Search and
Retrieval of Audio," in
Handbook of Multimedia Computing, ed. B. Furht,
pp. 207-225, CRC Press, 1999.
-
Foote,
J., "Automatic Audio Segmentation using a Measure of Audio Novelty," in
Proc. ICME 2000.
-
Scheirer,
E., "Tempo and Beat Analysis of Acoustic Musical Signals," in
J. Acoust. Soc. Am. 103(1), Jan 1998, pp
588-601.
-
Goto,
M., and Muraoka, Y., "A Beat
Tracking System for Acoustic Signals of Music," in
Proc. ACM Multimedia 1994, San Francisco, ACM.
-
Scheirer, E., "Using
Musical Knowledge to Extract Expressive Performance Information from
Audio
Recordings," in Readings in Computational Auditory
Scene Analysis, eds. Rosenthal and Okuno, Lawrence Erlbaum,
1998.
-
Foote,
J., "Visualizing Music and Audio using Self-Similarity," in
Proc. ACM Multimedia 99, Orlando, FL, pp. 70-80.
-
Rabiner,
L., and Juang, B.-H., Fundamentals of Speech
Recognition, Englewood Cliffs, NJ, 1993
-
Foote,
J., "Content-Based
Retrieval of Music and
Audio," in Multimedia Storage and Archiving
Systems II, Proc. SPIE, Vol. 3229, Dallas, TX. 1997.
-
MPEG
Requirements Group. "Description
of MPEG-7 Content
Set," Doc. ISO/MPEG N2467, MPEG Atlantic City Meeting, 1998.
(Information on
obtaining the Content Set may be found at http://www.darmstadt.gmd.de/mobile/MPEG7/Documents/N2570.html.)
(Table of Contents)
![]() and
and ![]() is calculated from audio frames
i and
j
. A simple distance measure is the Euclidean distance in the parameter
space. To remove the dependence on magnitude (and hence energy, given
our features), the product can be normalized to give the cosine of the
angle between the parameter vectors.
is calculated from audio frames
i and
j
. A simple distance measure is the Euclidean distance in the parameter
space. To remove the dependence on magnitude (and hence energy, given
our features), the product can be normalized to give the cosine of the
angle between the parameter vectors.


![]()


